How to make a Climate Graph
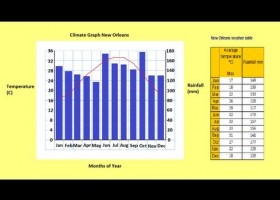
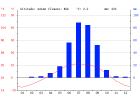
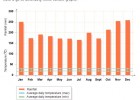
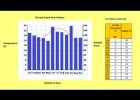
Climate graphs are useful for identifying climate patterns in a location. They consist of a blue bars graph representing rainfall for each month of the year ...
-
Idioma:
- Inglés
-
Formato:
Vídeo
Recurso educativo
Tipo de recurso
- Vídeo
- Teoría
Uso del recurso
- Clase
- Grupo reducido
- Individual
-
Aún no hay comentarios, ¡comparte tu opinión! Inicia sesión o Únete a Tiching para poder comentar


¿Dónde quieres compartirlo?
¿Quieres copiar el enlace?